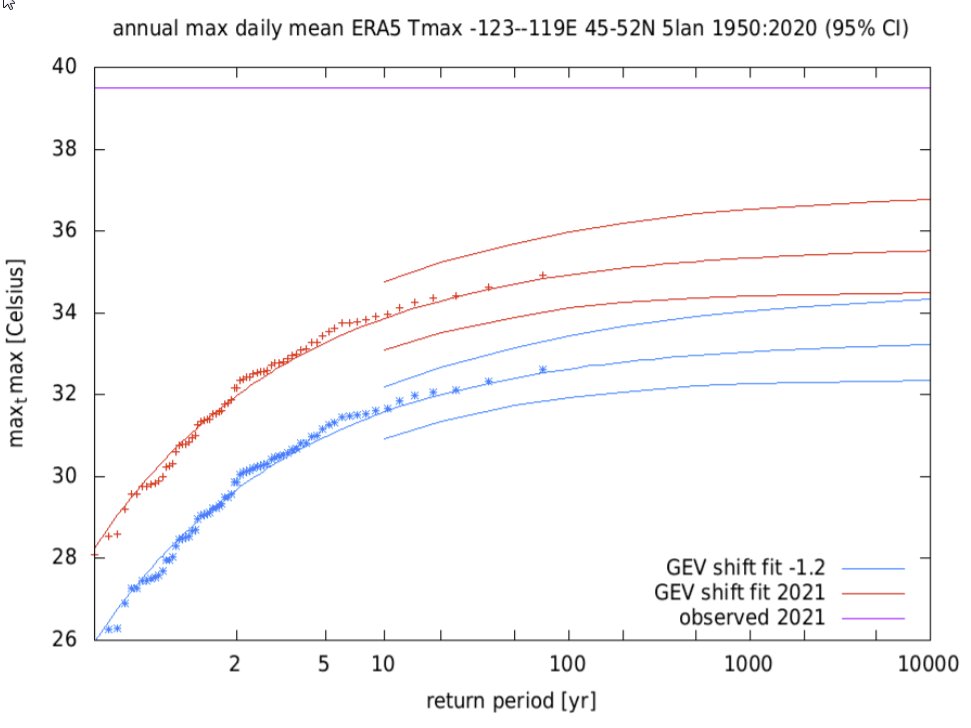
Dr. Robert Rohde on Twitter: "I've had a little time to digest the WWA report on the Northwest heatwave: https://t.co/KsLz3Owjy8 The most striking thing to me isn't the headline numbers, it's this graph. Basically, it says the heatwave was statistically "impossible". Let me elaborate...… https://t.co/1MQGp3LcTO"
Lead Scientist @BerkeleyEarth. Physics PhD, data nerd, and cancer survivor. Usually focused on climate change, fossil fuels, and air quality issues.
You can add location information to your Tweets, such as your city or precise location, from the web and via third-party applications. You always have the option to delete your Tweet location history. Learn more
By embedding Twitter content in your website or app, you are agreeing to the Twitter Developer Agreement and Developer Policy.
The fastest way to share someone else’s Tweet with your followers is with a Retweet. Tap the icon to send it instantly.
I've had a little time to digest the WWA report on the Northwest heatwave: https://www. worldweatherattribution.org/wp-content/upl oads/NW-US-extreme-heat-2021-scientific-report-WWA.pdf … The most striking thing to me isn't the headline numbers, it's this graph. Basically, it says the heatwave was statistically "impossible". Let me elaborate...pic.twitter.com/Zv7qv0Im2u
The graph, shown above, looks at temperature patterns observed in the Pacific Northwest over the last 70 years and applies what is known as Generalized Extreme Value (GEV) theory to it. The fit, shown in red, looks pretty reasonable. 2/


