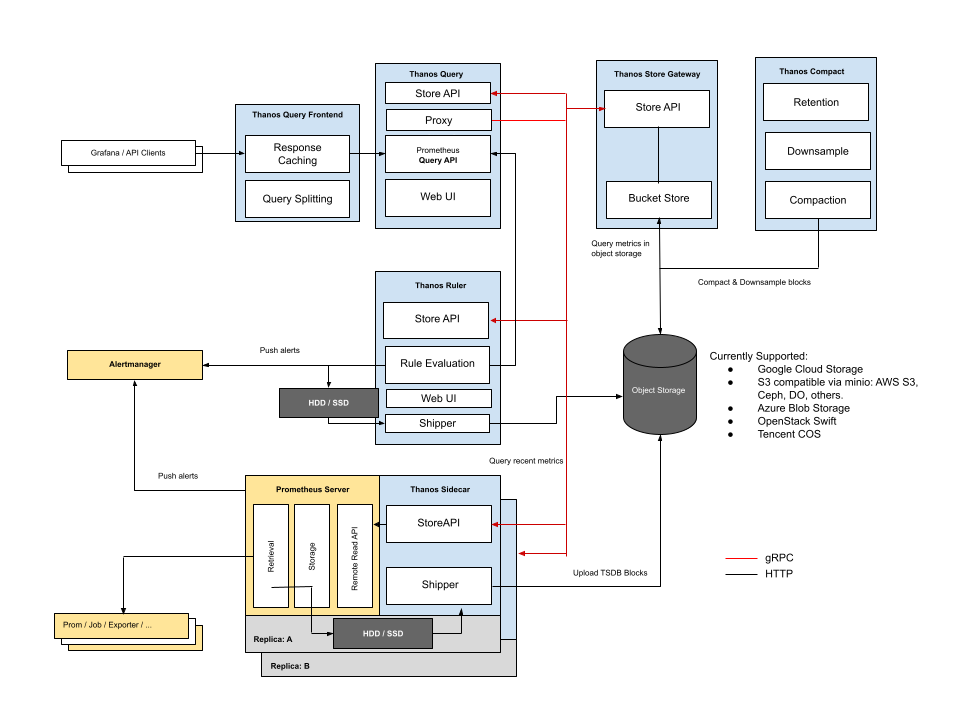
“THANOS” — Monitoring with Prometheus and Grafana
When I started working as a DevOps Engineer, I was introduced with the concept of Monitoring, Either it’s infrastructure level monitoring, application level monitoring or something like that. Let’s consider a scenario where we have an infrastructure of more than five hundred servers, In any case we are bound to do the pro-active monitoring of our whole infrastructure very efficiently and smartly in order to meet the service level agreements and keep the system up and running. If we are any sort of service provider then we must keep an eagle’s eye on whole of our stack. When I was a bit new I saw monitoring of a huge infrastructure with sensu, where I got the basic concept of how monitoring of the whole Infrastructure is being done, Moreover I also saw the transition where the modern monitoring techniques are being used and at that point I was introduced with some tools for monitoring like sensu, prometheus and grafana etc.
In order to setup a baseline monitoring setup in a containerized environment, you need to have a basic understanding of Docker and prometheus. Here I have wrote a blogpost previously where I have setup the stack in an easy and simple way.

