Timeline: 150 Years of U.S. National Debt
Recent increases to the debt have been fueled by massive fiscal stimulus bills like the CARES Act ($2.2 trillion in March 2020), the Consolidated Appropriations Act ($2.3 trillion in December 2020), and most recently, the American Rescue Plan ($1.9 trillion in March 2021).
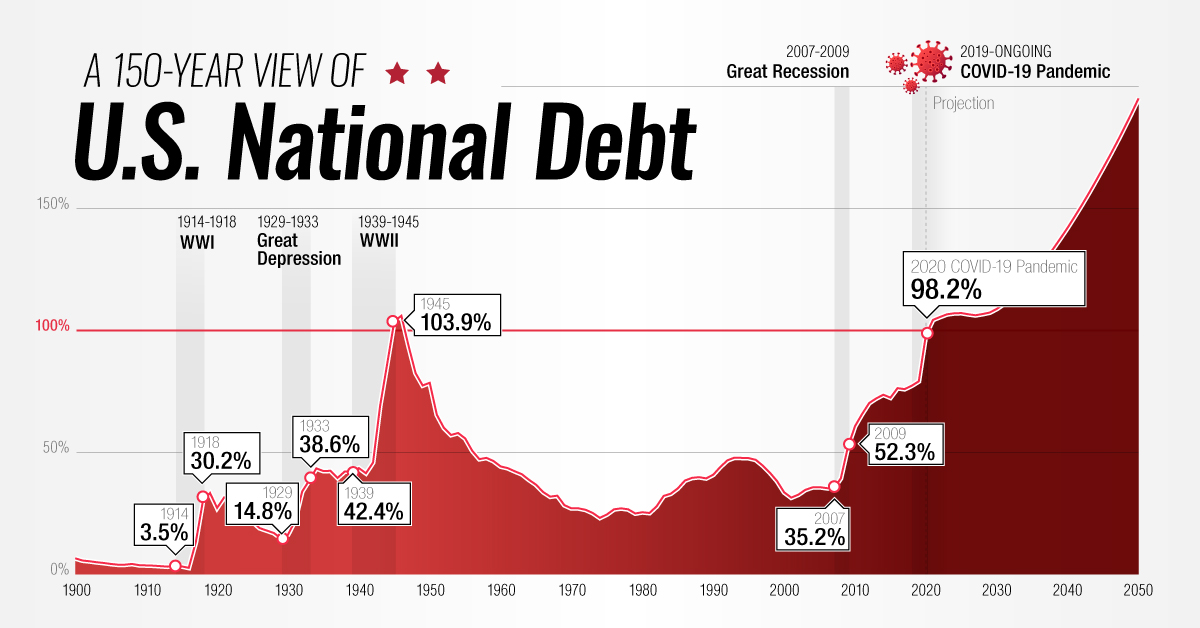
To see how America’s debt has gotten to its current point, we’ve created an interactive timeline using data from the Congressional Budget Office (CBO). It’s crucial to note that the data set uses U.S. national debt held by the public, which excludes intergovernmental holdings.
*Editor’s note: This top level figure includes intragovernmental holdings, or the roughly $6 trillion of debt owed within the government to itself.
Looking back 150 years, we can see that its size relative to GDP has fluctuated greatly, hitting multiple peaks and troughs. These movements generally correspond with events such as wars and recessions.
To gain further insight into the history of the U.S. national debt, let’s review some key economic events in America’s history.


/cdn.vox-cdn.com/uploads/chorus_asset/file/25415669/1238020424.jpg)


