Crime in San Francisco
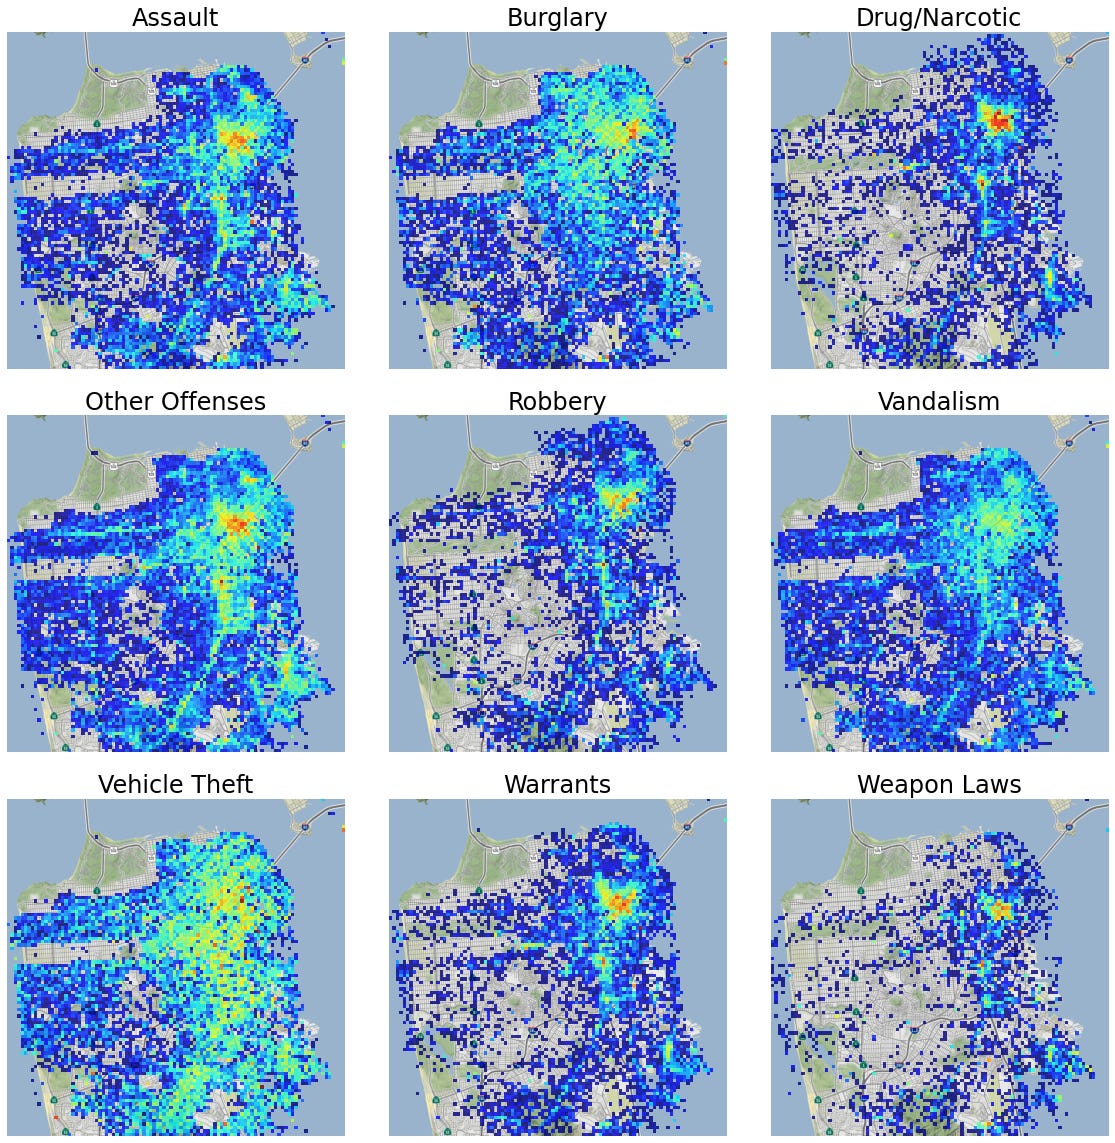
Welcome to the first post of the Vis4Sci substack! This will we will use Seaborn’s FacetGrid and contextily to visualize the San Francisco crime dataset from Kaggle.
The Kaggle San Francisco Crime Classification playground competition published an interesting dataset on the time and locations of different kinds of crimes in San Francisco.
contextily - is a small Python 3 (3.6 and above) package to retrieve tile maps from the internet. It can add those tiles as basemap to matplotlib figures or write tile maps to disk into geospatial raster files.
seaborn - a Python data visualization library based on matplotlib. It provides a high-level interface for drawing attractive and informative statistical graphics.
FacetGrid is one of the great features of seaborn that is able to slice a given DataFrame along the values of one or more columns and invoke function to plot each subset of data within a matplotlib Axes object.
We start by doing a quick data cleaning by removing data points with erroneous latitude/longitude coordinates. Using the range of the remaining coordinates, we use contextily to download the tile maps for our area of interest.


