Trace Query Processing Internals with Debugger
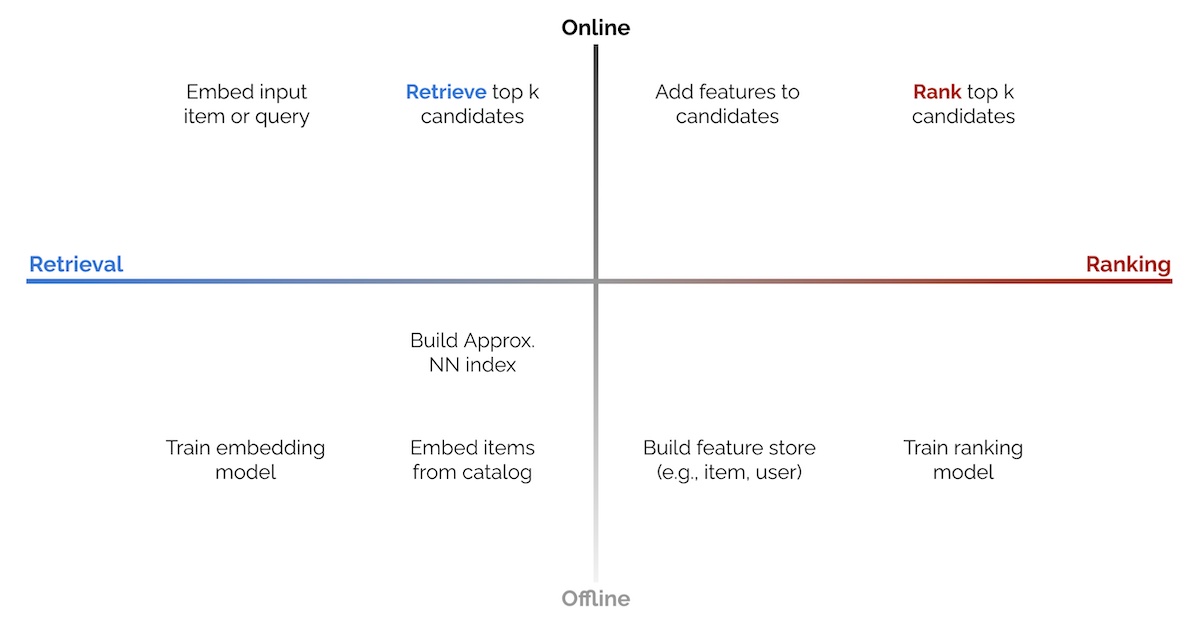
In this article we will use GDB debugger to trace the internals of Postgres and observe how an input query passes through several levels of transformation (Parser -> Analyzer -> Rewriter -> Planner -> Executor) and eventually produces an output.
This article is based on PG12 running on Ubuntu 18.04, and we will use a simple SELECT query with ORDER BY , GROUP BY, and LIMIT keywords to go through the entire query processing tracing.
GDB debugger is required to be installed to trace the internals of Postgres. Most recent distribution of Linux already comes with gdb pre-installed. If you do not have it, please install.
For GDB to be useful, the postgres binaries have to be compiled with debugging symbols enabled (-g). In addition, I would suggest to turn off compiler optimization (-O0) such that while tracing we will be able to examine all memory blocks and values, and observe the execution flow properly.
For referencing purposes, I would suggest enable debug log for the Postgres server by modifying postgres.conf located in database home directory. In this case it is located in