Prometheus, but bigger
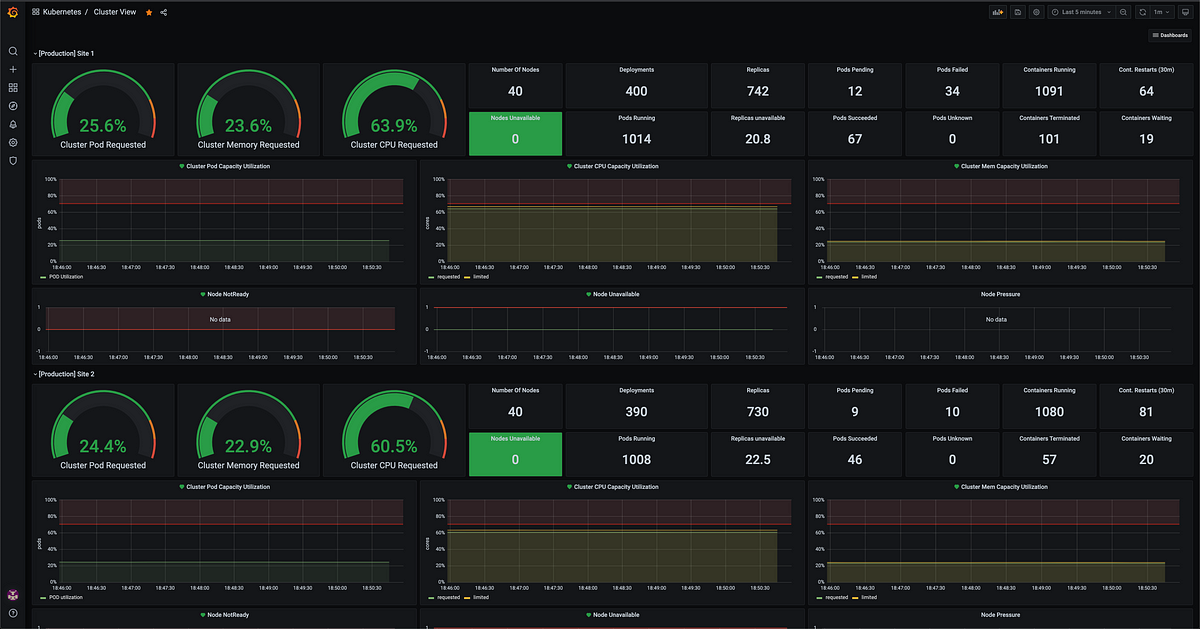
Up until January 2021, I have been using an enterprise monitoring solution to monitor Kubernetes clusters, the same one used for APM.
It felt natural, the integration with Kubernetes was quite easy, only minor tweaks needed, and APM and Infrastructure metrics could be integrated, really nice and magical.
But despite the ease of collecting and storing data, creating alerts using metrics had huge query limitations, we would often end up with alerts that differed from what our dashboards were showing. Not to mention that with 6 clusters, the number of metrics being collected and stored was pretty big, adding a huge cost to our monthly expenses.
But, what to use? Grafana was the obvious choice for the visual part, but what could we use for the "backend" that had the resilience and availability we needed?
"Pure" OpenTSDB installations demanded too much work and attention, Standalone Prometheus did not offer replication and I would end up with multiple databases, TimeScaleDB looked nice, but I am no Postgres administrator.





/cdn.vox-cdn.com/uploads/chorus_asset/file/25416369/STK473_NET_NEUTRALITY_CVIRGINIA_A.jpg)
