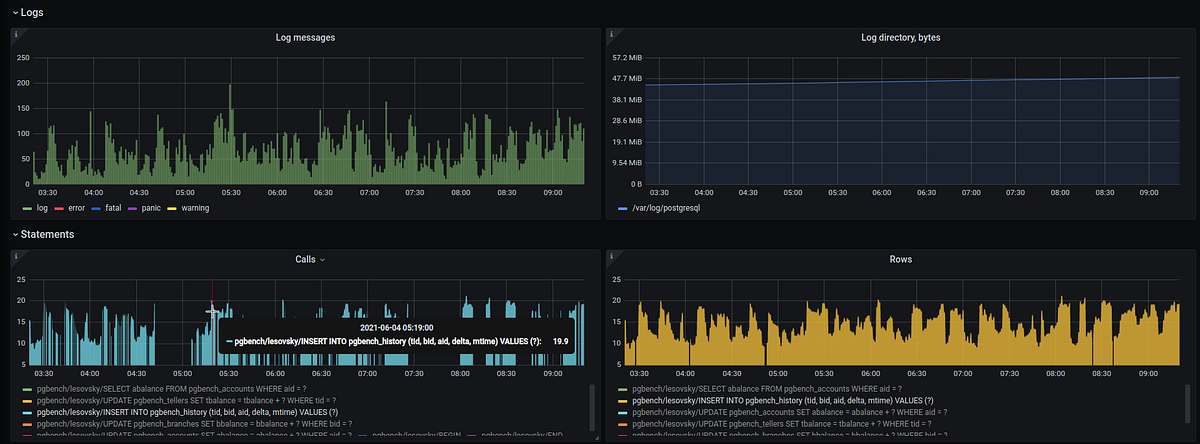
Grafana dashboards for pgSCV.
A week ago I announced pgSCV — a new metrics exporter for PostgreSQL. After that, some people asked me about dashboards — it will be nice to provide dashboards for pgSCV. I had a task to make dashboards in my todo list, and the request for dashboards didn’t surprise me. This is obvious, pgCSV provides a lot of metrics, and even seasoned DBAs need a lot of time to understand all of that and then make a dashboard.
I’ve made and published dashboards which cover the most metrics from pgSCV, but not the all. In this post I am going to make a quick review and tell what is inside the dashboards.
I would like to emphasize, these are initial versions of dashboards, they will be extended or changed in the future. Now there are three dashboards, because pgSCV can expose metrics about PostgreSQL, Pgbouncer and operating system. In next releases of pgSCV it is planned to collect metrics about other Postgres-related tools, like pgBackrest, Patroni and similar, hence the list of dashboards will also be extended.
I would like to emphasize, these are initial versions of dashboards, they will be extended or changed in the future. Now there are three dashboards, because pgSCV can expose metrics about PostgreSQL, Pgbouncer and operating system. In next releases of pgSCV it is planned to collect metrics about other Postgres-related tools, like pgBackrest, Patroni and similar, hence the list of dashboards will also be extended.




.jpg)


/cdn.vox-cdn.com/uploads/chorus_asset/file/25416369/STK473_NET_NEUTRALITY_CVIRGINIA_A.jpg)
