Using Kepler GL to Visualise over 35,000 Earthquakes near Christchurch, New Zealand
From their site, “Kepler.gl is a data agnostic, WebGL empowered, high-performance web application for geospatial analytic visualizations.”. To me, that’s a way to view data in unique or interesting ways, which gets my attention. So I sat down for an evening to play, to see if I could visualise the earthquakes from New Zealand — specifically Christchurch and Kaikoura in Canterbury, over the last 10 years. For those who are unaware, Christchurch had some devastating earthquakes in 2010–2011, followed by thousands of aftershocks, and Kaikoura up the coast had their own brutal shake in 2016.
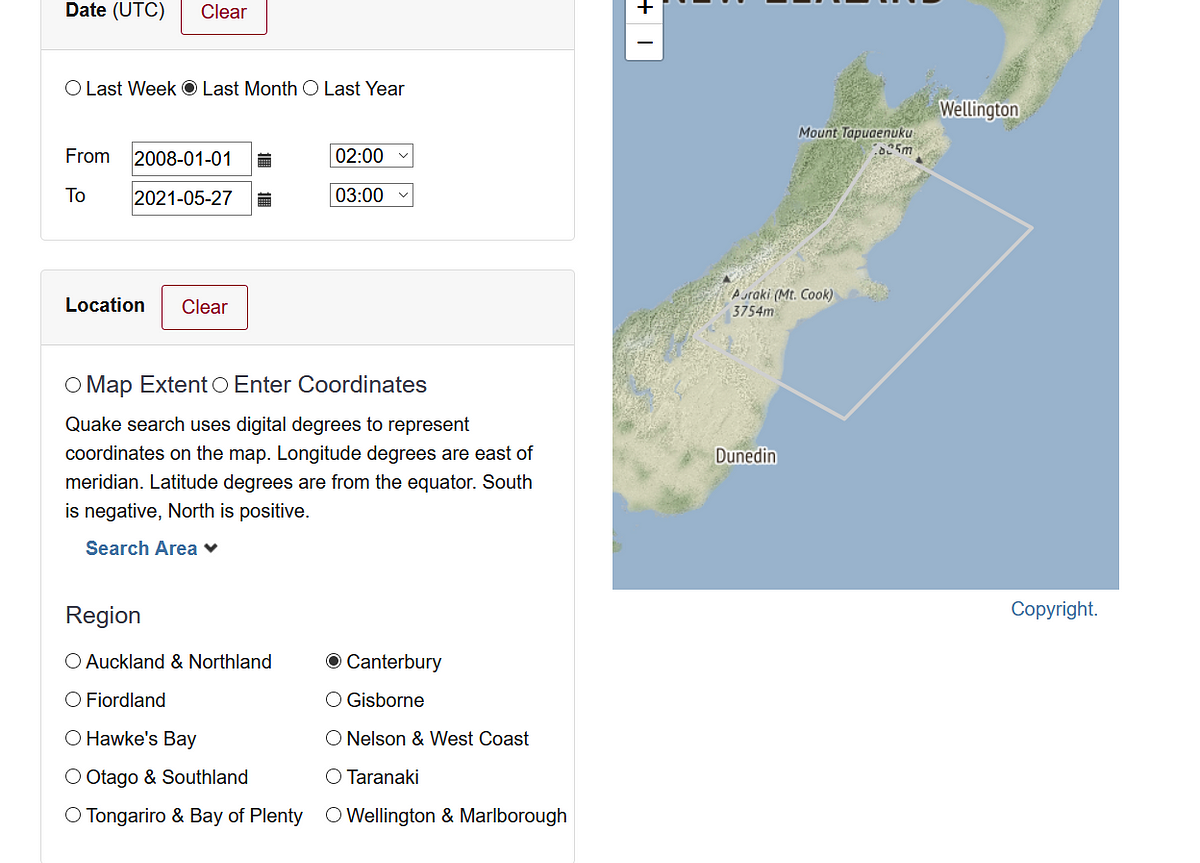
Data, we need data. To get all the earthquake data, Geonet is a government provided data source of earthquakes (as well as volcanic warnings and other such alerts). They’ve helpfully provided a Quake Search, which allows you to produce CSV files of a particular region, period and all the shakes in that time.
Clicking ‘Get Started’ on Kepler takes you to this page, which allows you to load data for the visualisation. This is where we load the CSV file:








.png)


