So We've Got a Memory Leak… | Steven Harman — Maker & Breaker of Things
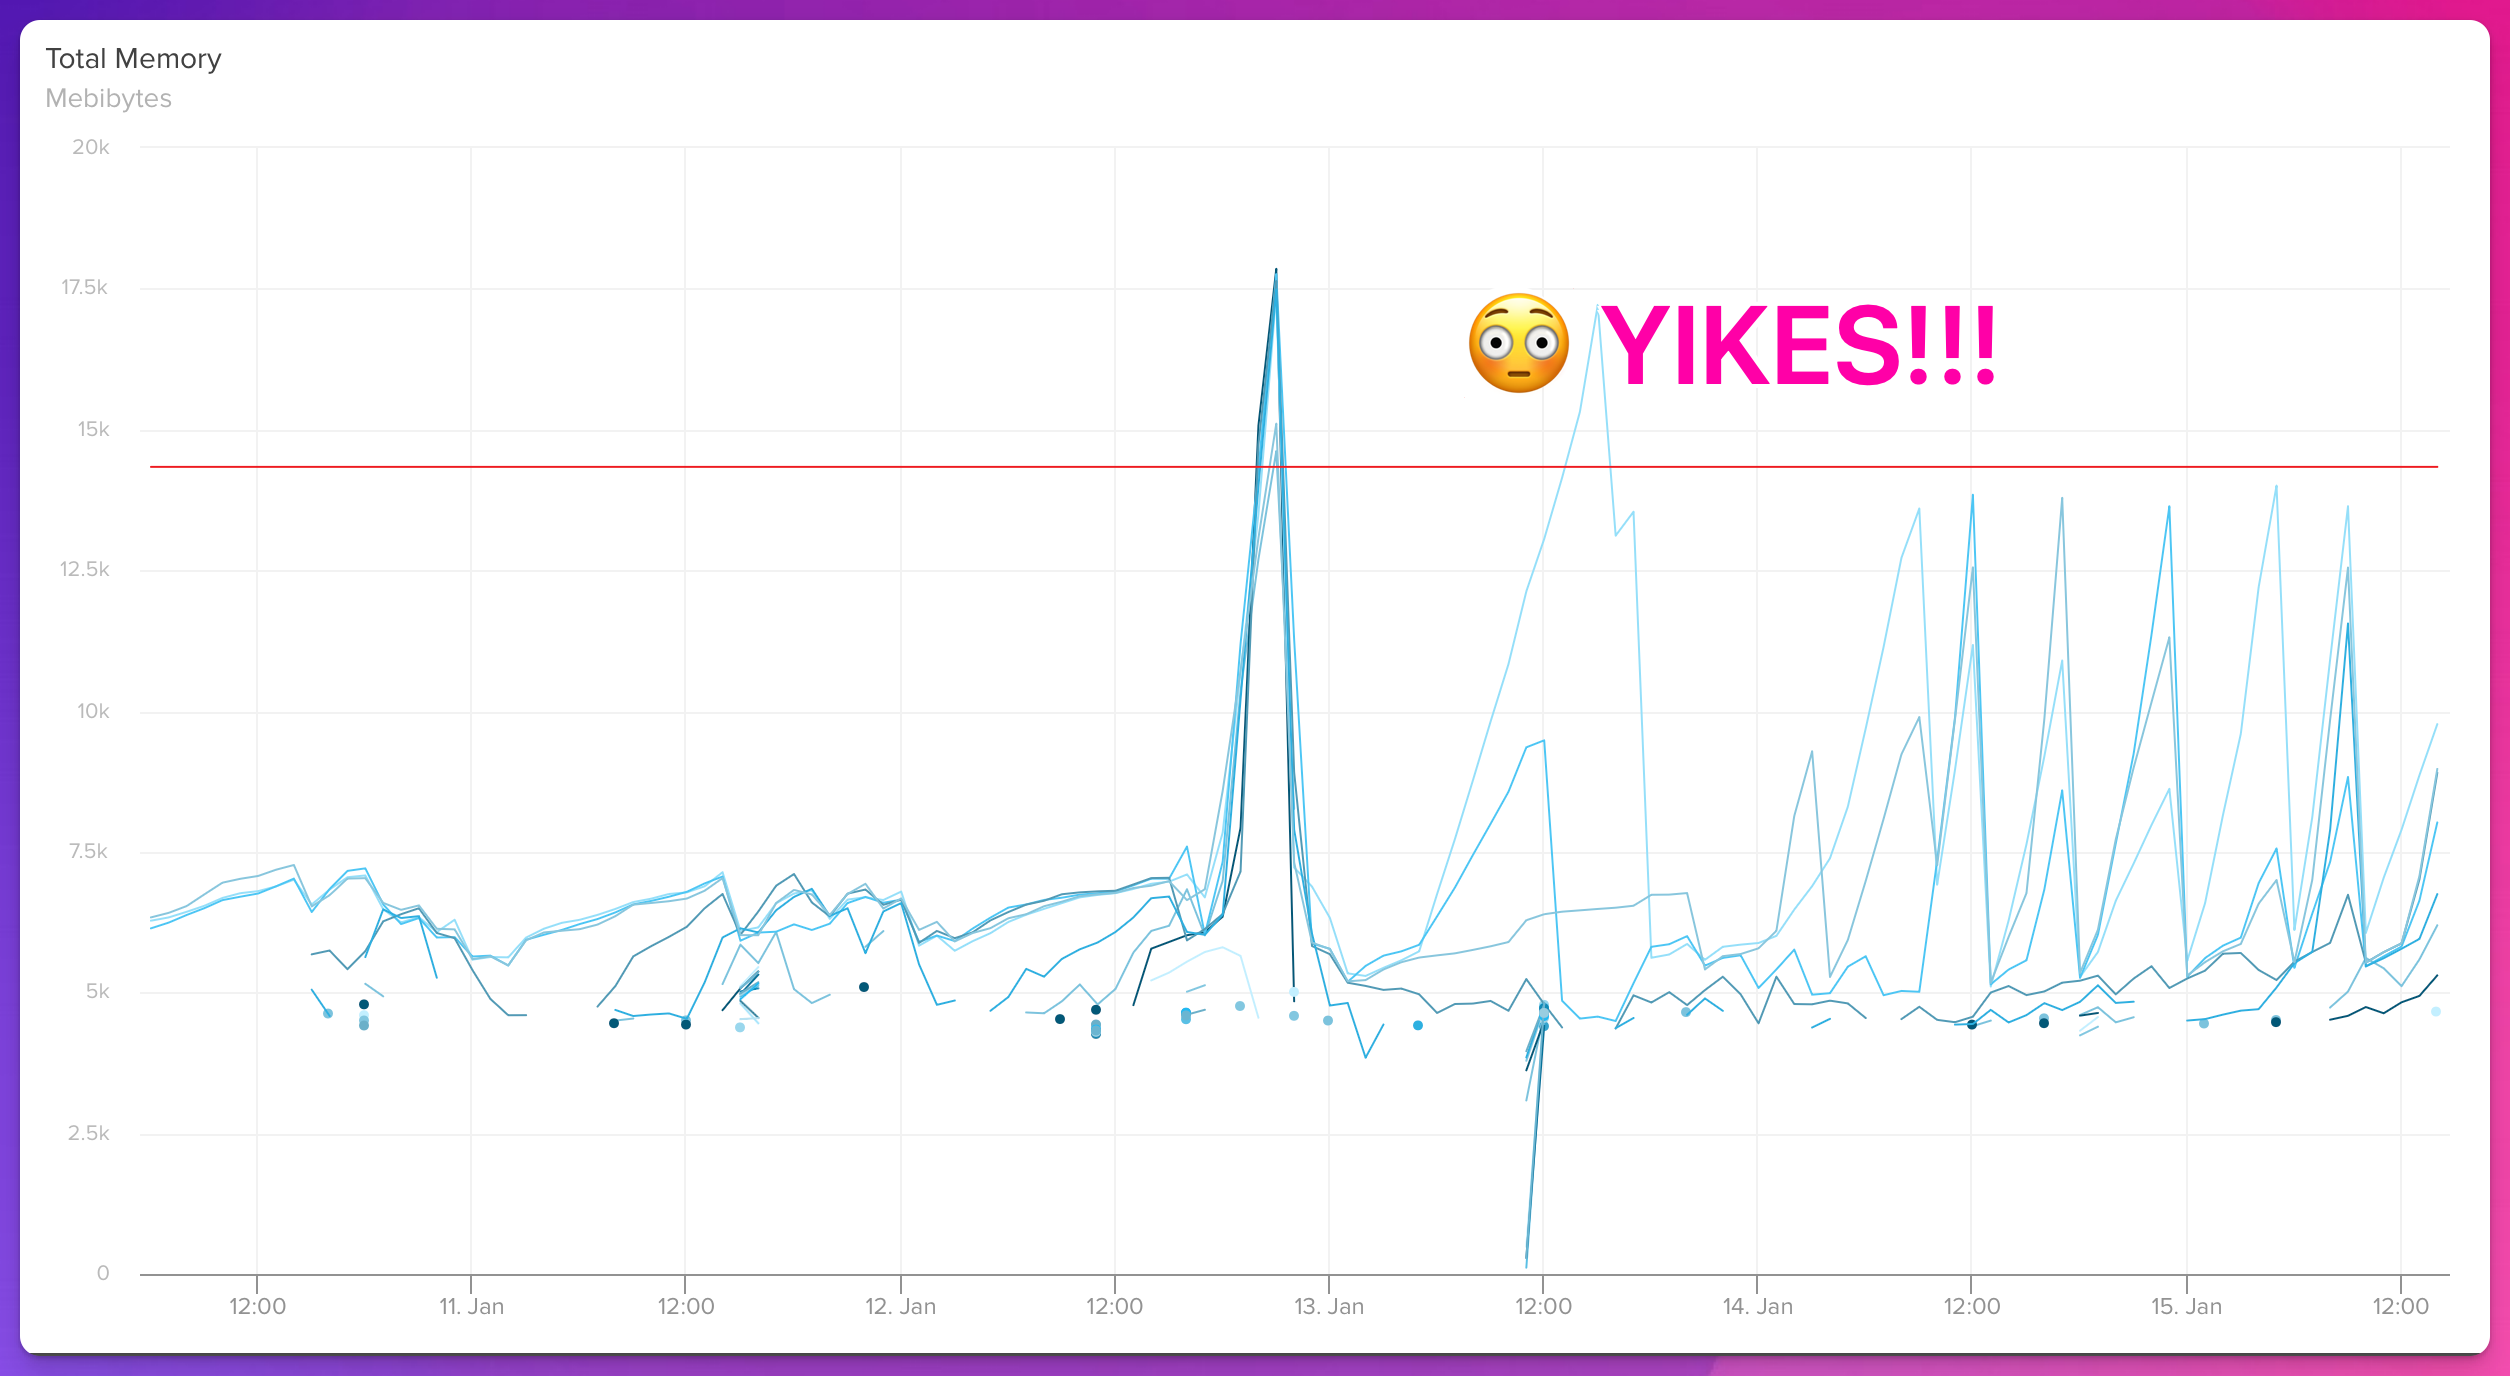
Memory leaks happen. And if you’re here, reading this, I’d bet you’re dealing with one. First things first - are you sure it’s a leak, and not bloat?
Okay, so it’s a leak. Much has been written about various tools for profiling a leak, understanding heap dumps, common causes of leaks, work being done to improve Ruby’s memory layout, and so much more. Ben Sheldon’s recent “The answer is in your heap: debugging a big memory increase in Ruby on Rails” is a great example. Ben mentions and shows how he and some teammates used several different tools to generate heap dumps, analyze and interrogate them, and ultimately find and fix the source of a leak in Rails itself.
These are all great resources, and can be crucial knowledge in our hunt for a leak. But they all suppose we already have an idea of where to start looking, or use stripped down examples to showcase the tools. The memory_profiler Gem can profile memory allocations around some suspect code, if we already know that code is suspect. Derailed Benchmarks can get us started on tracking down a leak in the overall stack, or a known problematic resource, and generate heap dumps for us. Comparing those dumps with heapy can point us in the right direction by revealing memory being unexpectedly retained over time. We can use sheap to track down exactly where problematic objects allocations are happening, once we’ve identified those problematic objects.
But what if we’ve reviewed all recent code changes, and nothing stands out? Or if the leaks don’t happen consistently, across all instances of the running app? Or memory starts leaking different times? Where do we even start?


