Breakpoint Detection Tool
Drag & drop your CSV file onto the blue area above, or select a file from your computer. The file should be in CSV format and it can contain multiple columns. There should be at least one column with dates or times, and one column with numerical values.
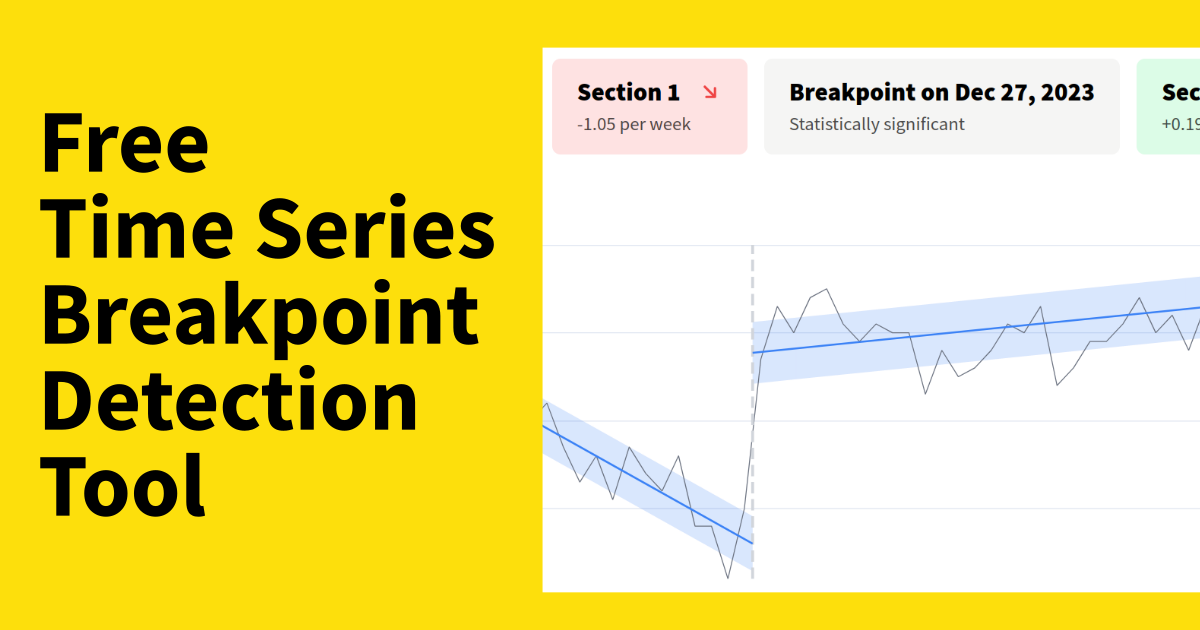
The free breakpoint detection tool will run statistical tests to find out if there is a significant change in the trend of your time series data. The tool will also show you a plot of the data, with the detected breakpoint marked and the trend lines before and after the breakpoint.
Statistics is tricky. Sometimes, it looks like your data changed direction at a certain point, or made a sudden jump. But often this could be just random variation. Breakpoint detection helps you find out if the change in your data is very likely to be real.
Once the calculations and tests are done, the tool will show you a plot of your data with the detected breakpoint marked. It will also generate explanations that help you understand the results.


/cdn.vox-cdn.com/uploads/chorus_asset/file/25431700/STK201_SAM_ALTMAN_CVIRGINIA_A.jpg)


/cdn.vox-cdn.com/uploads/chorus_asset/file/25654261/2175197872.jpg)

