This open-source tool increases microservices visibility
Click, click, click. “OK, I've now logged into the dashboard. Only 250 clicks to go before I get these 3 tasks done. Gosh, I love GUIs,” thought no engineer ever.
Almost every engineer I've ever worked with has preferred to review their services through a CLI rather than a dashboard. For the longest time, I thought it was a matter of pride — that you can control systems without touching a mouse. l337 vibes.
I understood the real reason after playing around with a Jenkins GUI a while back. It was a phenomenal chore to click, click, click, click, click to get around. For those of us with fast typing speeds, it's much easier to type out commands.
But visual information can be worth bashing your left mouse button in specific situations. As systems become more complex, we can benefit from visual representations of data.
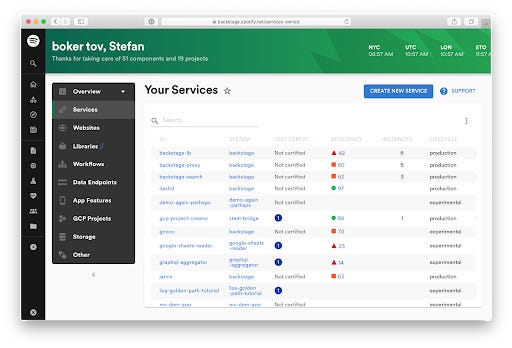
If you have pulled one or more triggers, here's one visual tool in particular that I think will rock your (engineering) world.


