AnyChart integration for the Financial Trading Dashboard with Python Django
Please note, API data availability depends on your subscription plan. Some data isn’t included in the free plan. Visit our pricing page to find the package that fits your needs.
This article builds upon the previous two in the series, “Build a Financial Trading Dashboard with Python Django” and “Enhancing the Financial Trading Dashboard with Python Django”.
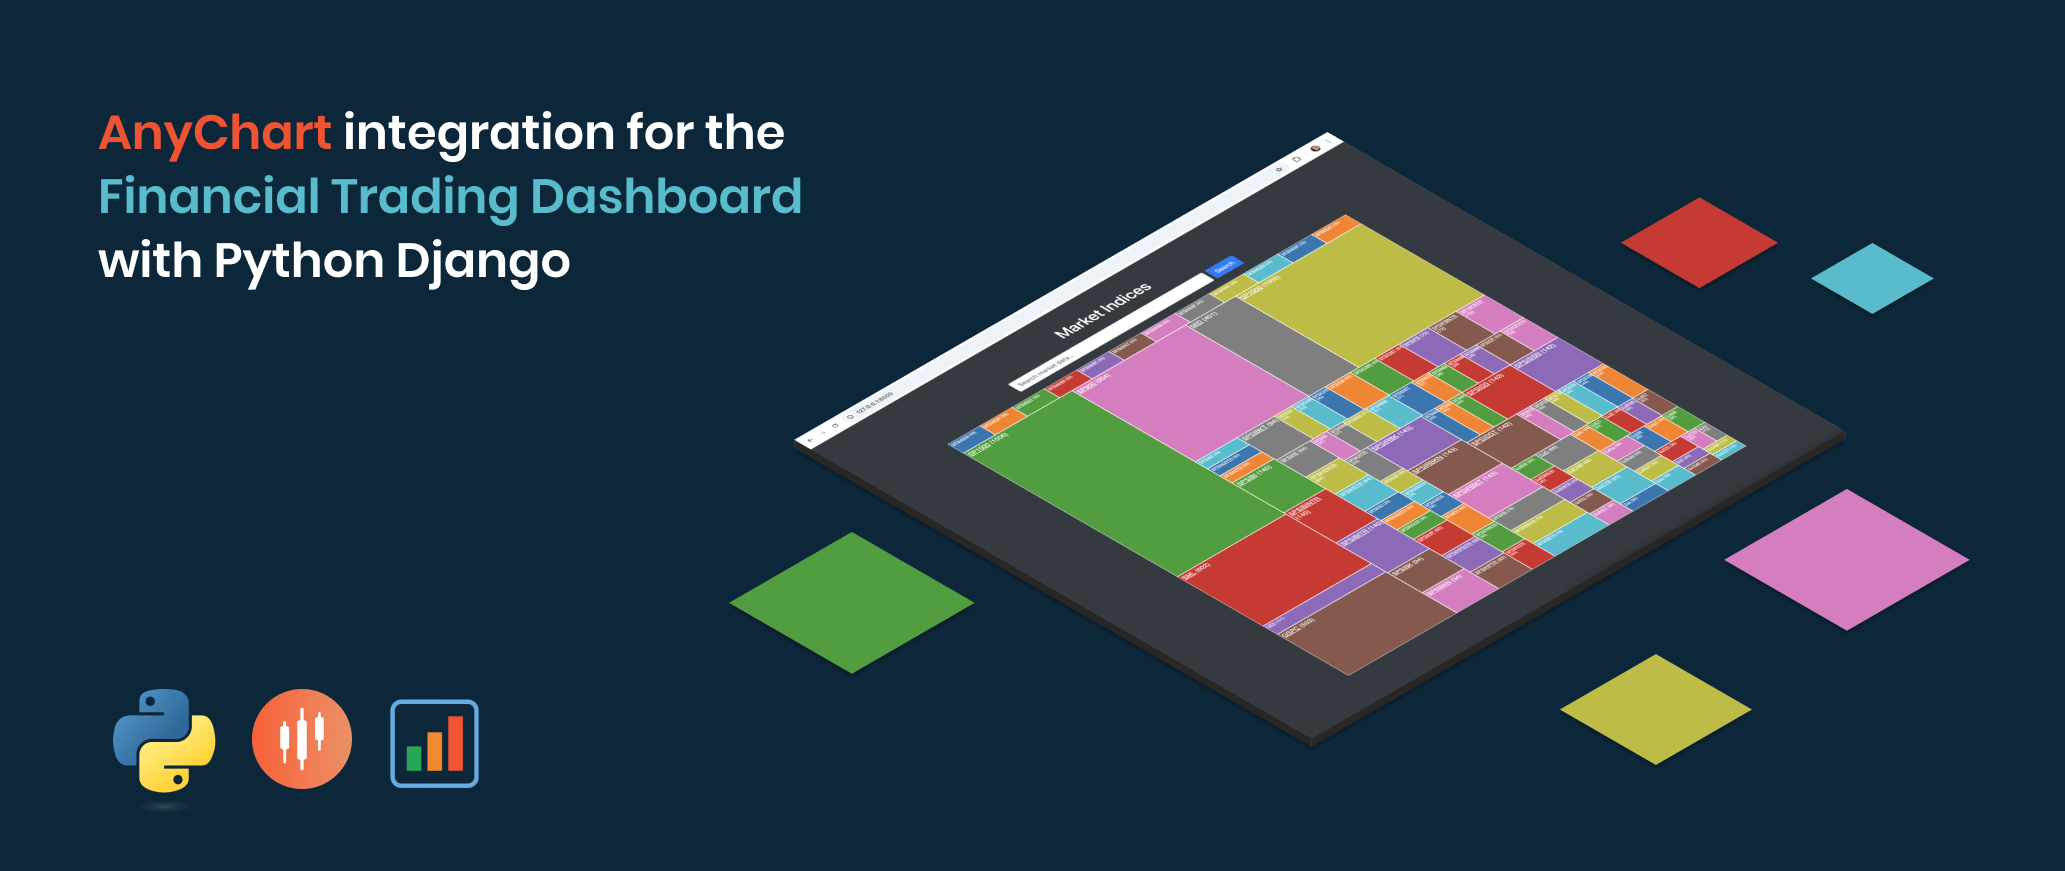
Initially, I created the treemap on the landing page using the D3.js library. While it worked well, I wanted to explore other charting options, so I evaluated both Chart.js and AnyChart. Ultimately, I decided to migrate the treemap from D3.js to AnyChart. Although the visual appearance of the charts is quite similar, I found AnyChart’s code significantly more intuitive and easier to understand. Additionally, I personally feel that the AnyChart treemap offers slightly more functionality and appears more polished. That said, I also liked the aesthetic of Chart.js, which remains a viable option.
In the previous article, I created a page displaying the historical data of a market, presented neatly using a Bootstrap data table. For this article, I wanted to include an appealing stock chart above the table. Once again, I considered the three charting libraries, but I was particularly impressed with the way AnyChart presented the data and the functionality it offered. This article will explain how this was achieved.


