Search code, repositories, users, issues, pull requests...
Plots, scatter plots, histograms and heatmaps in the terminal using braille dots, and foreground and background colors - with no dependancies. Make complex figures using the Figure class or make fast and simple plots using graphing function - similar to a very small sibling to matplotlib. Or use the canvas to plot dots, lines and images yourself.
Basic support for timeseries plotting is provided with release 3.2: for any X or Y values you can also add datetime.datetime, pendulum.datetime or numpy.datetime64 values. Labels are generated respecting the difference of x_limits and y_limits.
Support for heatmaps using background colors for figures and displaying images binary with braille, or in color with background colors using the canvas - provided with release 4.0
If you are still using python 2.7, please use plotille v4 or before. With v5 I am dropping support for python 2.7, as the effort to maintain the discontinued version is too much.
Leave a Comment


Recent Posts


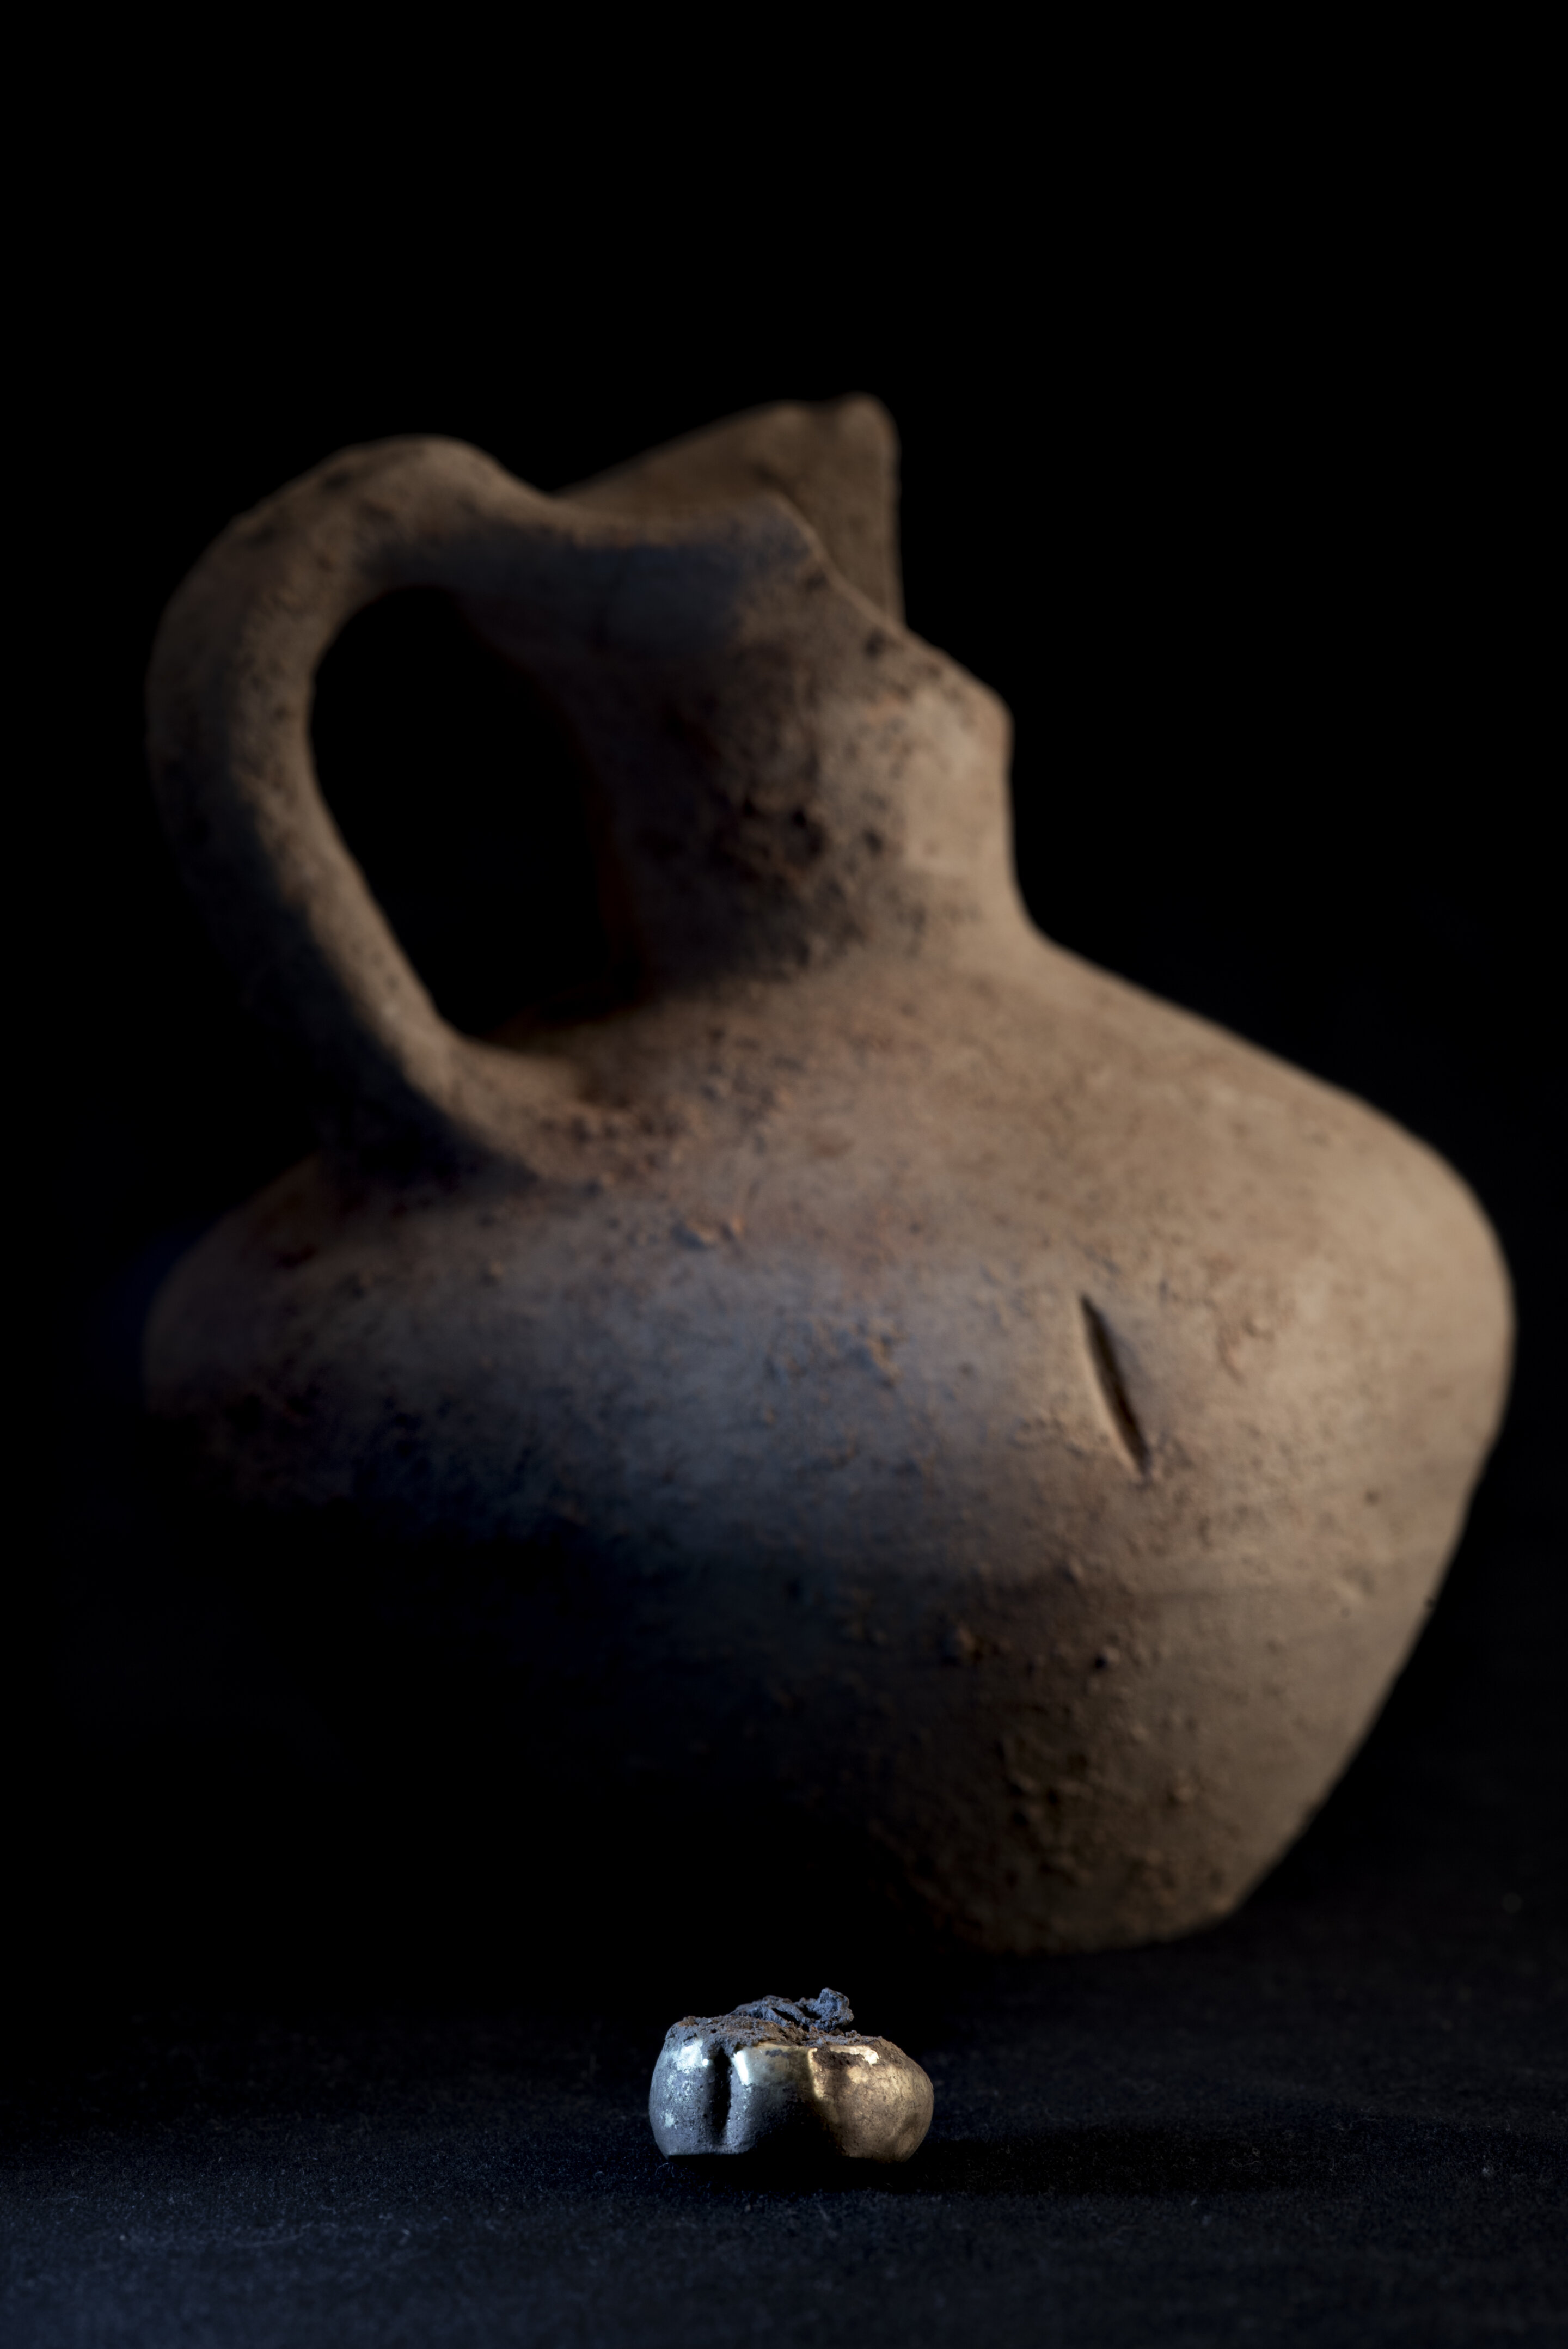
A devastating fire 2,200 years ago preserved a moment of life and war in Iron Age Spain, down to a single gold earring
Comment