Continuous Integration Dashboard for Apache NuttX RTOS (Prometheus and Grafana)
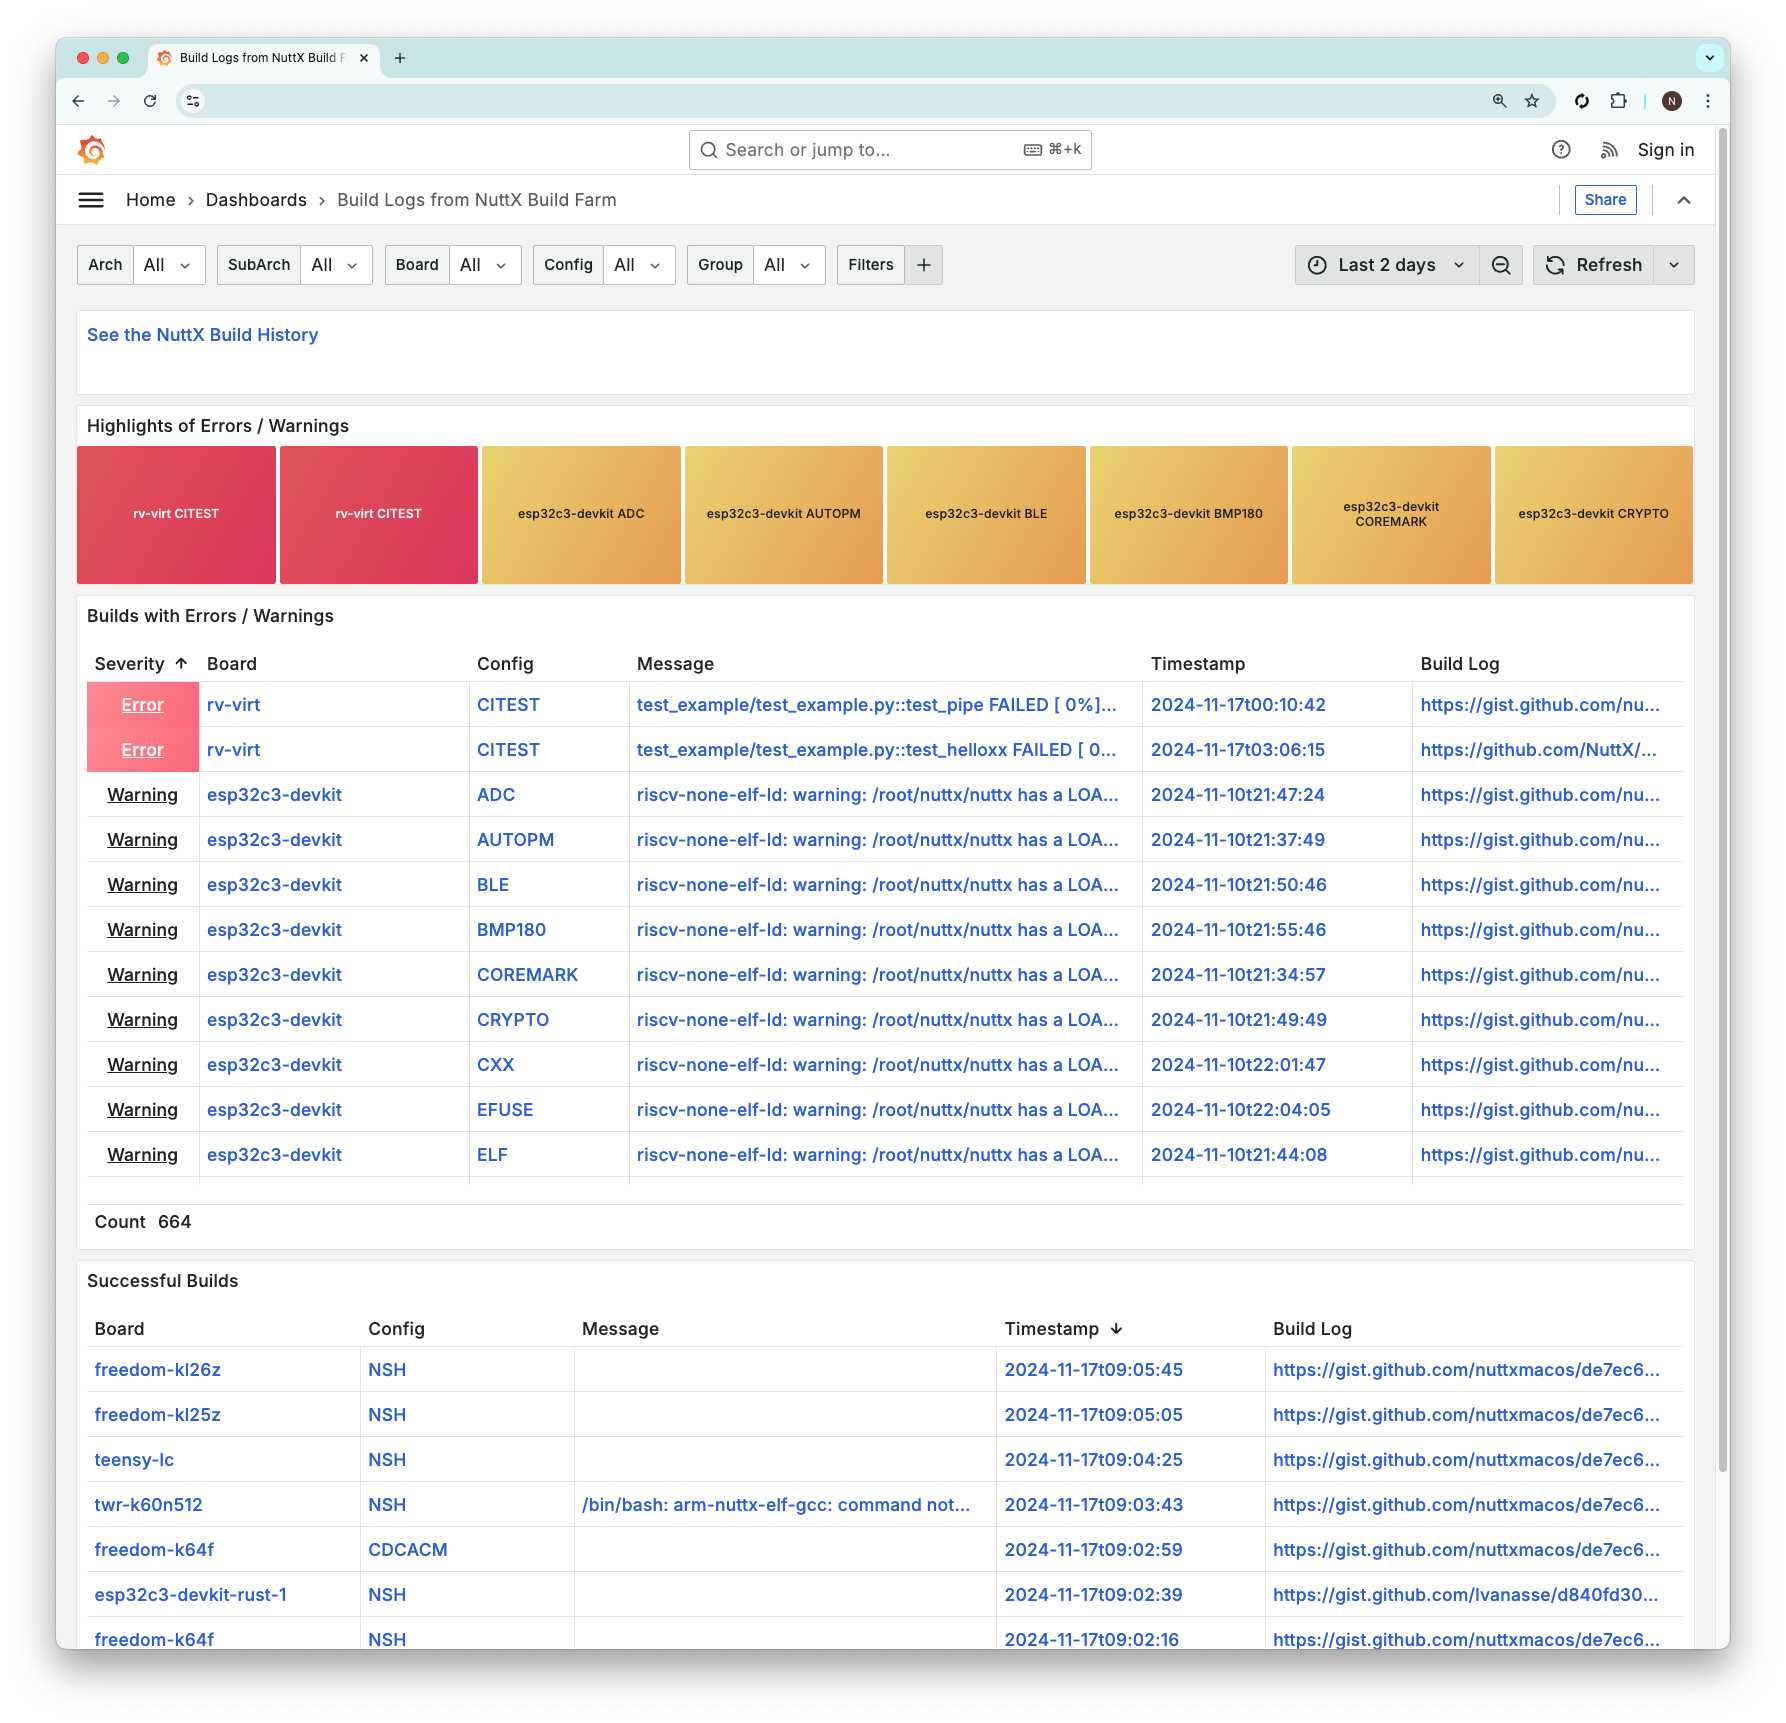
To see the History of Builds: Click the link for “NuttX Build History”. Remember to select the Board and Config. (Pic below)
Sorry can’t print it here, our dashboard is under attack by WordPress Malware Bots (!). Please head over to NuttX Repo and seek NuttX-Dashboard. (Dog Tea? Organic!)
Sadly there isn’t a “programming language” for coding Grafana. Thus we walk through the steps to create our NuttX Dashboard with Grafana…
That’s why we install Pushgateway as a HTTP Endpoint (Staging Area) that will serve the Build Score (Metrics) to Prometheus.
Refurbished 12-Core Xeon ThinkStation ($400 / 24 kg!) becomes (hefty) Ubuntu Build Farm for Apache NuttX RTOS. 4 times the throughput of a PC!
Yes NuttX Dashboard will tell us the Commit Hashes for the Build History. But the Batched Commits aren’t Temporally Precise, and we race against time to inspect and recompile each Past Commit.
Next Article: We chat about the updated NuttX Build Farm that runs on macOS for Apple Silicon. (Great news for NuttX Devs on macOS)

